
The following article builds on top of the business perspective described in my previous article. If you haven’t checked that one out, I’d highly recommend you do that first. We defined what data-driven business process improvement is, how it’s done most efficiently, and who is responsible for it.
In the second part of this series, I want to shine a light below the so often depicted iceberg to discuss how to design the data warehouse, data pipelines, and solution architecture to assist our business department on its journey optimally.
Current Reporting System Landscape and its Users
To figure out what works best, let’s have a look at the status quo and see which kind of user group uses which kind of reporting today and see if the gap ( data-driven process improvement) can either be closed by an existing solution or, if not which attributes a new tool would need to have to do that.
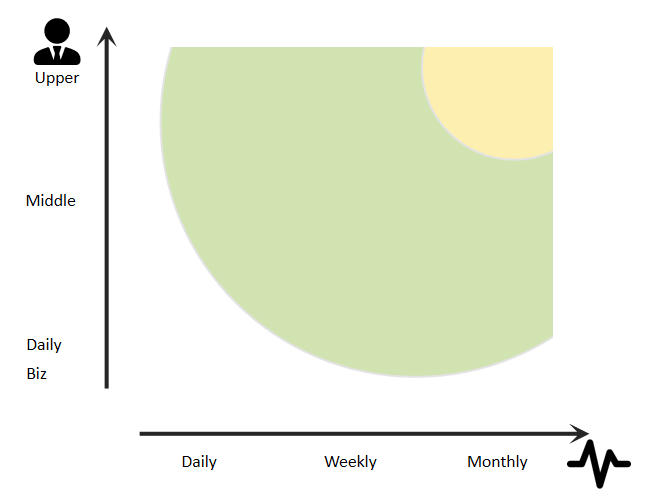
The image above shows the user groups that consume reporting (y-axis) and the frequency reporting is needed by them (x-axis). Each group and frequency has different requirements on which information is relevant and how to consume it.
Operational Reporting
Operational reporting (White Space) is the reporting layer used by specialists daily to verify the daily operations and smoothness of processes in the systems. Questions that a reporting system in this layer answers are, e.g.:
- Were all invoices posted?
- Have all goods been sent out to the customer?
- Are there any processing errors?
The focus for this kind of reporting lies in the actuality of the data. This layer is also the only kind of reporting that really needs to have a real-time view of transactions in the system. In most other cases, real-time integration has more downsides, namely higher complexity, workload, and therefore cost in setup, than upsides.
Gladly, daily reporting does not have deep analysis requirements as time is usually too short to spend much of the day on analysis. Therefore a quick reporting is generally set up in the transaction system where the specialist acts.
Summary Operational Reporting:
- Real-Time
- Low Complexity
- Low Amount of Data
- Source System capability
- Specialists Job
Core KPI Layer
The Core KPI Layer (yellow) contains the top KPIs that are necessary to run the company. Decisions made at this level are strategic and take time to show their impact on the actual data. These KPIs are therefore crucial and must be comparable over long periods of time. e.g.:
- Are the strategic products selling as good as expected?
- Are we reaching our target concerning profit?
- Which regions are contributing most to the overall success?
A system that produces the figures to answer these questions must be stable, reliable, and able to deal with vast amounts of data. These requirements cause the system to have long, complex development cycles and data load restrictions due to the massive amounts of data.
Traditionally most companies have a sophisticated data warehouse solution that deals with the core KPI layer requirements. As described in my previous article, it’s usually the Controllers Job to use this data source, pick and analyze the critical data points and prepare a storyline for the top management.
Summary Core KPI Layer:
- Stable & Reliable
- Long Development Cycles
- Huge Volumes of Data
- High Complexity
- Business Warehouse System
- Controllers Job
Agile KPI Layer
The Agile KPI Layer (green) contains all the error analysis, reporting, and nitty-gritty that the middle manager needs to run the business under his responsibility. The insights that a middle manager wants to derive from data are more short-term but need to be more flexible than top management’s requirements. The data volumes needed are smaller but need to be more detailed instead. e.g.:
- How high was the automation rate of invoice postings in the last month an why?
- Which customers cause most of the late payments and therefore negatively impact the cashflow planning?
- Which return reasons are causing the majority of our disputes with customers?
Traditionally companies rely on the swiss army knife of software: Excel to answer these questions. Data is downloaded manually from various sources, wrangled in huge Excel sheets, sometimes with questionable methods to derive the monthly reporting.
Although being very flexible, it requires a lot of manual work, errors and only allows for shallow analysis.
Summary Agile KPI Layer:
- Flexible
- Short development Cycles
- Midsize volumes of data
- Excel
- Middle Managers Job (but not really)
The Gap to Close
We see that from the three reporting layers, the agile KPI layer is the one that’s not optimally supported by software. The lack of software support is mainly because this space is the newest. Previously, Excel and operational reports were just enough to handle those requirements. However, the increase in data collection and the centralization of tasks in a Shared Service Center make it less and less feasible to handle these tasks in Excel.
Furthermore, computing and storage costs have decreased tremendously over the last years, turning the cost-benefit analysis in favor of an automated solution in more and more cases. These developments lead to a widening gap that is not adapted by many companies today.
The Best-Practice Solution Architecture
By looking at the different requirements for each layer, it’s now obvious that just increasing Operational Reporting capability or building more Data Warehouse reports will not solve the problem.
The show stopper for integrating the agile requirements into the core KPI layer is the long development cycles and IT effort involved. It’s like taking a sledgehammer to crack a nut. The operational Reporting falls short in the source systems capabilities for advanced analysis. Furthermore, a source system reporting only allows insight into the data that that specific source system stores. Often, insights are gained by combining data from many data sources along the process.
Looking at the very different nature of the agile KPI layer, we need a new solution that can deal with the increased complexity, data volume, and business requirements.
In the process, we first tried using only Self Service BI tools (SAP Analytics Cloud or Power BI) to fulfill the requirements in our first rotation of development. While those tools have very impressive calculation and presentation capabilities, they lack the modeling and automation capability to handle dataset joins that lead to result tables in the size of 1M rows and 100 columns.
In our experience, after around 25M cells, it gets messy. Calculations have long run times or fail. Joins with more than five tables are hard to work with at any size.
This led to frustration and confusion for our business department because they had to deal with a very complex and fragile system now that felt to be a bit too small for its big shoes. After long hours of thinking, prototyping, deleting, and adjusting, we settled for the below approach.
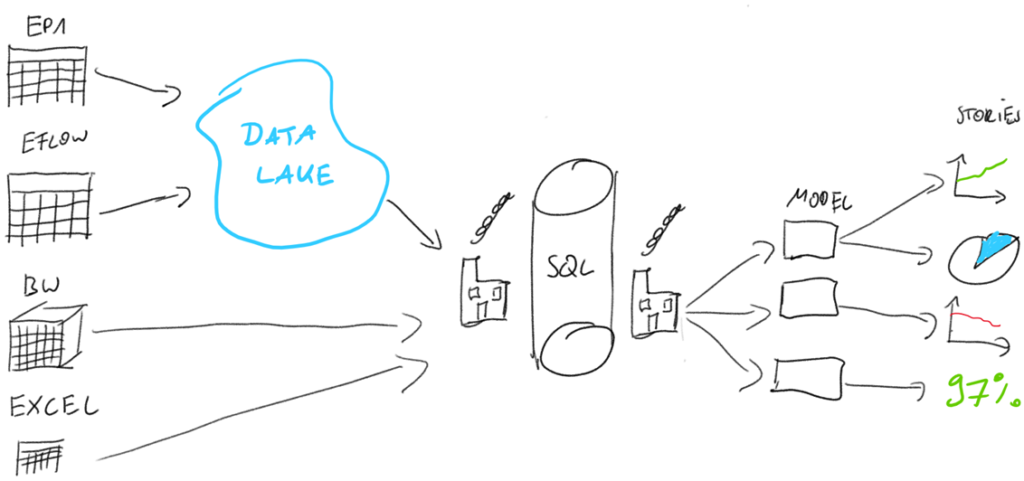
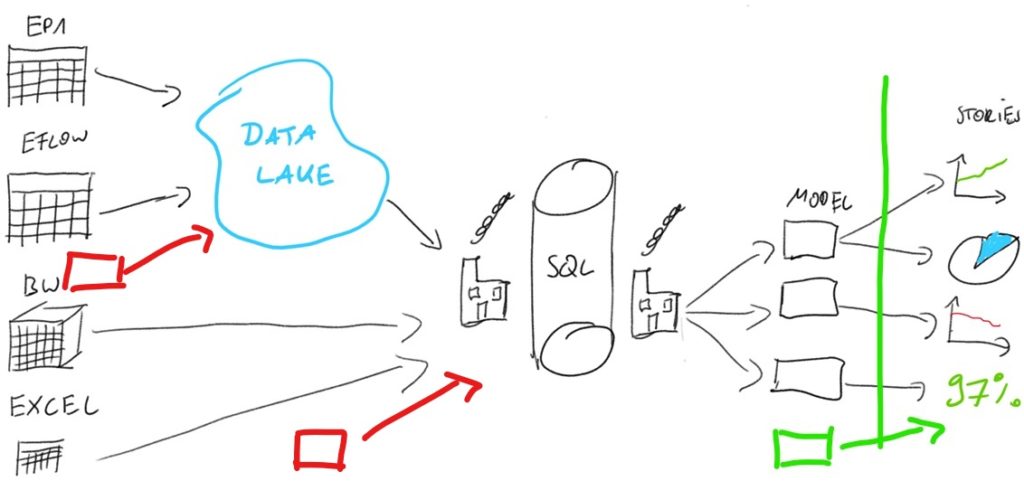
The image shows the final architecture of the flexible warehouse:
- The data sources in our case are:
- Transactional System (EP1)
- DWH system that sits on top of the Transactional System
- External Business Workflow system called EFLOW
- Additional Excel files that contain additional business logic or report downloads from other software that is not yet automatically connected.
- Data is extracted from the EP1 system and EFLOW system into the companies Data Lake.
- We can access the data from the Data Lake, DWH, and Excel with the help of the Azure Data Factory.
- A data warehouse in an Azure SQL Server that executes ETL functions and adds business logic where necessary.
- The result of this transformation is data model tables that BI tools like SAP Analytics Cloud or Microsoft Power BI can access and build dashboards from.
Let’s look at the advantages and trade-offs that this architecture makes that make it a much better fit for the agile KPI Layer and fulfill the requirements for agility while providing automation that allows for deep root cause analysis.
Changeability & Extendability by Business
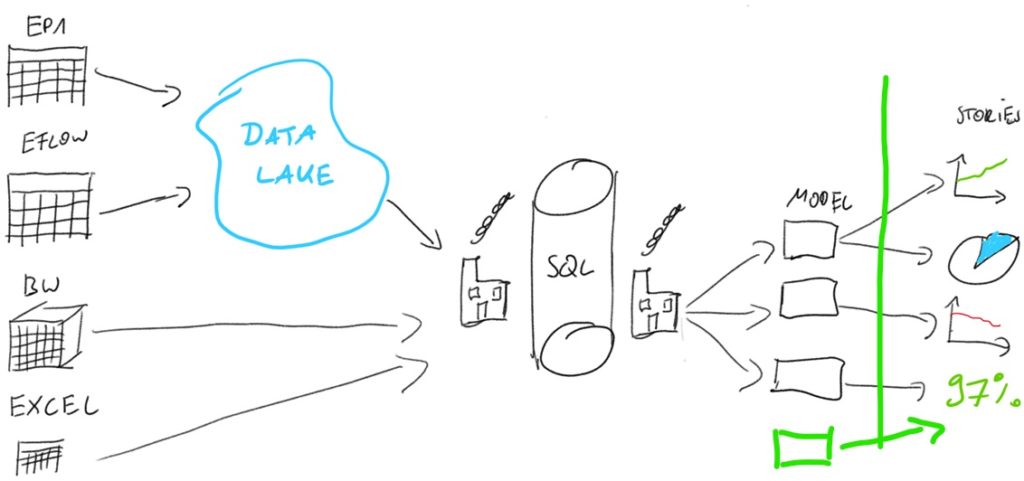
We first have to transfer the knowledge of how to design and build dashboards and reports with self-service BI tools to business key users. Handing governance of the display layer over to business gives them all the freedom they had with Excel while automating the data preparation and later the consumption of the report. Everything in the presentation area is business responsibility (right to the green line)
Training a group of key users is only possible through hands-on training and persistence, as it takes a while to get through the highs and lows of adopting new technology. Especially because business departments seem to love Excel 😉
In our experience, around 90% of business logic and KPI can be calculated on the fly in the BI tool and are therefore under full control of the business department to change them in a self-service manner. Again, this is contrary to the classical DWH system, where the business logic is calculated in the reporting cube and set up by IT.
The second requirement is extendability. This means adding additional dimensions to the models. Adding further dimensions quickly is possible because we can join each model table of the flexible data warehouse with other manually added files (green box in the above image) in the BI tool of choice.
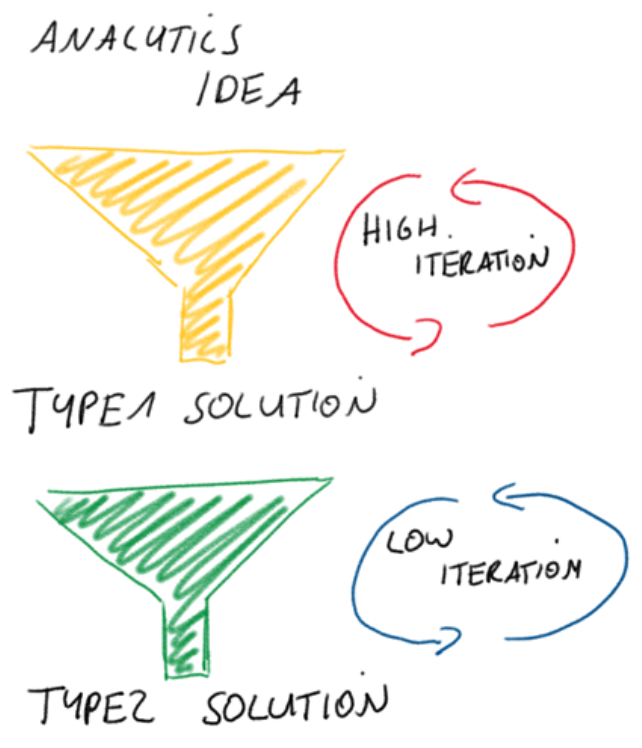
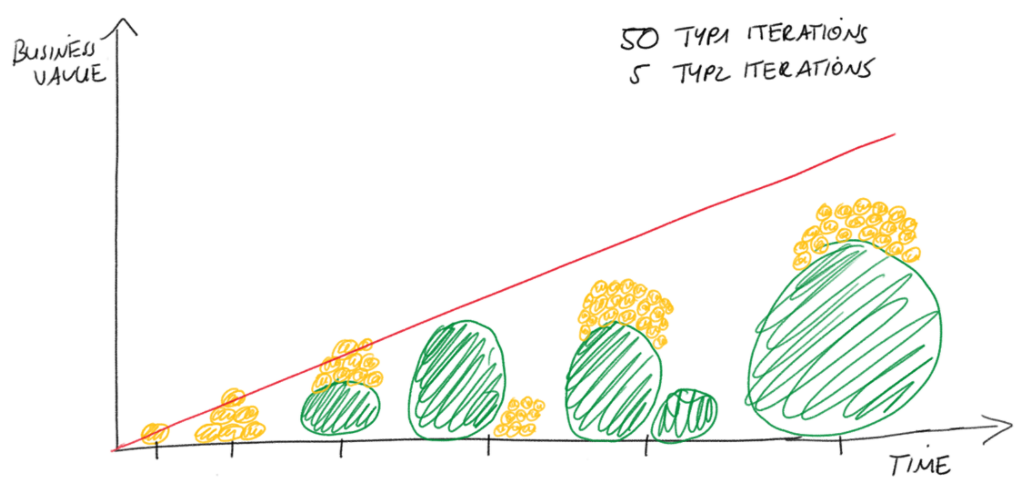
Changes or extensions by the key users we ended up calling Type 1 changes. They have high flexibility, are easy to implement, and don’t involve any IT staff. Business users can try out new ideas and additional requirements this way.
There is a trade-off in that these Type 1 changes increase complexity for the key users and decrease automation. The key users must make sure that the data is correctly joined and maintain the additional files manually.
Because of that, there is another change we ended up calling Type 2 change. A Type 2 change is always preceded by a Type 1 change that serves as the blueprint for the Type 2 change. A Type2 change moves the data source further back in the pipeline to automate the ETL.
This move will increase automation and decrease complexity for the key users as the processing is handled automatically in the pipeline. However, it involves IT effort and additional testing of all affected data streams.
Handling changes in this two-step approach also decreases friction between Business and IT department where business fails to exactly describe what they want (IT perspective 🙂 ) or IT fails to understand the business idea (Business perspective 🙂 ) because the Type 1 change serves as a tested draft version.
Optimally, many Type 1 changes are combined into one bigger Type2 change because we can significantly reduce implementation and testing effort this way.
As shown below: Business value created by changes over time.
Short Development Cycles
Short Development Cycles are achieved by decreasing the over all complexity of the pipeline.
Luckily, leaving business logic to business is killing two birds with one stone. It enables our key users to take care of their business as before and implement changes independently. It also leads to shorter development cycles because of the decreased complexity in the pipelines. We implemented this concept with the following rule:
The more frequently a logic/procedure changes, the closer to the end we should put it in the pipeline
In our case, this means the following:
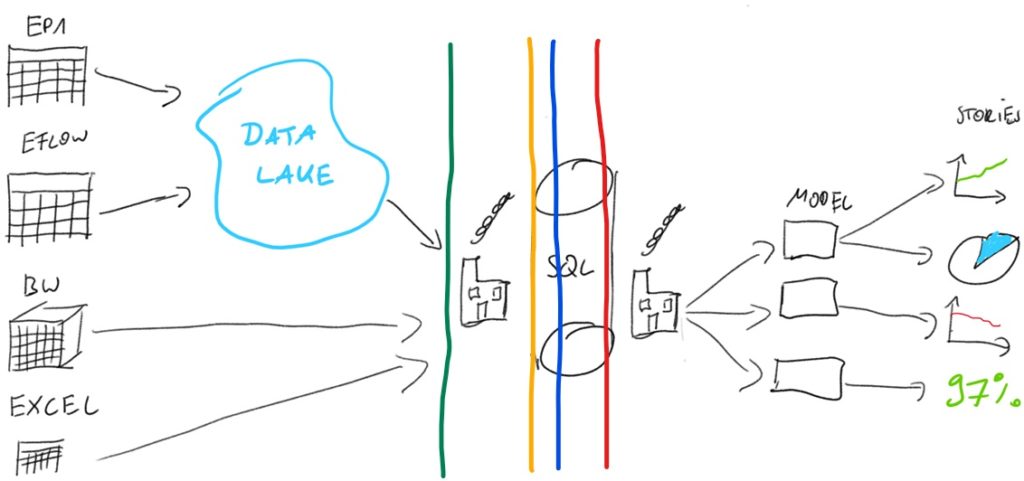
Until the green line, there is no logic whatsoever. The tables from the source systems are loaded entirely and without any delta update logic. Contrary to a classical DWH solution, the data volume is not huge, and storage and compute power are cheap nowadays.
Until the orange line, we filter the data by very high-level case specifics, e.g., Data from Chinese Entities.
Until the blue line, only general ETL functions prepare the data. There is still no specific logic. e.g. removing duplicates, special characters, formatting dates etc.
Until the red line, tables are prepared and joined into their natural objects. e.g., Invoice, Credit Line Workflow, etc.
Only after the red line business logic and frequently changing transformations take place.
This layered approach keeps the core stable and easily understandable even without business context. In practice we can implement most of the changes without ever touching anything before the red line. This makes testing much faster. The only exception being big Type2 changes.
Avoid storage tables completely
Inspired by the post of Maxime Beauchemin about functional data engineering, we decided not to use any UPDATE, APPEND, DELETE functions in the pipeline that are not idempotent, meaning that they don’t always deliver the same result.
While your database of choice may allow you to update, insert, and delete at will, it doesn’t mean you should. DML operations like UPDATE, APPEND and DELETE are performing mutations that ripple in side-effects. Thinking of partitions as immutable blocks of data and systematically overwriting partitions is the way to make your tasks functional. A pure task should always fully overwrite a partition as its output.
– Maxime Beauchemin
Instead, all transaction tables are completely recreated with each pipeline run. Following this rule allows us to add additional columns and calculations without worrying about any legacy data. For the legacy data we completely rely on the source system.
Getting rid of storing legacy data brings the advantage that we don’t have to write complex update routines for our tables or manually add columns to legacy data after we add a dimension. There are no slowly changing dimensions needed to be taken care of.
This eliminates the biggest source of errors and manual work in the development cycle and is the most significant difference compared to the classical DWH system that has to do complex delta updates.
The downside for easier extension and higher stability is:
- Losing accuracy
- The need for more processing power
- Relying on the source system data structures
A bit of accuracy is lost because if legacy data is changed in the source system, it is also changed in our flexible data warehouse. E.g., If a supplier name is changed, it is also adjusted for all legacy data under that supplier number.
More processing power is needed because we have to process all transformations on all historic data each time the pipeline runs. However, remember that the KPIs that we want to track are frequently changing. Therefore, it’s unnecessary to have a long history of legacy data in the system because the metrics are not comparable or needed anyway. In our case, we settled on keeping the rolling data for the past two years leading to a comparably low data volume of a couple million rows per year.
A third downside (theoretically) is that the source system data structures must track all the information and status updates for each object. E.g., If we want to track the duration of workflow steps by an object in our reporting, the source system must track each status change for each object and not only the latest status. In our source systems, this is the case.
We are very willing to make these trade-offs because of the different nature of the agile KPI layer. For the core KPI layer, it surely is a different discussion. Actually, this proves the point that another reporting layer is needed between the core KPI layer and operational reporting.
Key Take Aways
There is a gap between the classical (core) reporting layer and operational reporting not adequately supported by software. This layer has different requirements than the other two forms of reporting: flexibility and speed compared to the core reporting and the need for being cross-system compared to the other.
Since we can not fulfill these requirements with the existing tools, we need a new solution. This solution makes trade-offs to achieve short development cycles and user expandability by eliminating certain functionality of the core reporting layer.
This new tool is freeing up time that the business previously spent on manually creating (useless) monthly KPI reporting and spending it on data-driven process improvement that will save a lot of time and money by getting rid of inefficiencies in the mid to long term.